# Global setup + packages
set.seed(42)
options(width = 100)

pkgs <- c(
  "sf","terra","raster","dplyr","automap","gstat","mapview","stars",
  "readxl","stringr","tidyr","purrr","lubridate","rprojroot",
  "exactextractr","zoo","ggplot2","viridis","mgcv","randomForest","fields","sp","deldir",
  "leaflet","DT","htmltools","jsonlite","shiny" # viewer deps
)
need <- setdiff(pkgs, rownames(installed.packages()))
if (length(need)) install.packages(need, dependencies = TRUE)
invisible(lapply(pkgs, function(p) suppressPackageStartupMessages(library(p, character.only = TRUE))))Ecowitt Air Temperature — End-to-End applied Workflow
EON Summer School 2025
1 Overview
This document demonstrates and explains a six-stage spatial pipeline for Ecowitt temperature data:
- Ingest & clean: load two loggers, harmonize names, and aggregate to 3-hourly.
- Interpolation preview: per-timestep KED (universal kriging) and a multi-panel plot.
- Scale inference (L): fit a global variogram to get L50 / L95 (spatial correlation ranges).
- Scale-matched predictors: build DEM-derived rasters (optionally slope/aspect/TRI) at the right scale.
- Tune \(R^*\): select an optimal drift radius \(R\) with block-CV (U-curve), then benchmark methods.
- Diagnostics: export products, report scales, and compute an optional error budget.
Key concept: We use two DEMs on purpose — DEM_scale at native/coarser resolution drives scales, tuning, folds, CV, and error budget. DEM_render is an upsampled/aggregated DEM for pretty maps and interpolation output. This separation prevents the tuner from collapsing to 10 m just because pixels are tiny.
1.1 0) Requirements & Helpers
# Small utilities (kept identical to your working script where applicable)
# SpatRaster sicher "pinnen" (Datei-basiert) und als gültiges Objekt zurückgeben
.pin_rast <- function(r, crs = NULL, dir = NULL, name = "pinned") {
  stopifnot(inherits(r, "SpatRaster"))
  if (is.null(dir)) dir <- file.path(getwd(), "run_cache")
  if (!dir.exists(dir)) dir.create(dir, recursive = TRUE)
  f <- file.path(dir, paste0(name, ".tif"))
  # immer schreiben → garantiert datei-gestützt und voll materialisiert
  terra::writeRaster(r, f, overwrite = TRUE)
  rp <- terra::rast(f)
  if (!is.null(crs)) {
    # nur projezieren, wenn noch nicht identisch
    same <- try(terra::crs(rp, proj=TRUE) == as.character(crs), silent = TRUE)
    if (!isTRUE(same)) rp <- terra::project(rp, as.character(crs), method = "near")
  }
  # Sanity check
  invisible(terra::nlyr(rp))
  rp
}

# Prüfer: „lebt“ der Pointer?
.is_alive_spatr <- function(r) {
  inherits(r, "SpatRaster") && !inherits(try(terra::nlyr(r), silent = TRUE), "try-error")
}

# Safe, URL-friendly file slug
slug <- function(x) {
  x <- gsub("[^0-9A-Za-z_-]+","-", x)
  x <- gsub("-+","-", x)
  gsub("(^-|-$)","", x)
}

# Human-readable time labels from AYYYY... keys
pretty_time <- function(x) {
  vapply(x, function(s) {
    if (grepl("^A\\d{14}$", s)) {
      ts <- as.POSIXct(substr(s, 2, 15), format = "%Y%m%d%H%M%S", tz = "UTC")
      format(ts, "%Y-%m-%d %H:%M")
    } else if (grepl("^A\\d{8}(_D)?$", s)) {
      ts <- as.Date(substr(s, 2, 9), format = "%Y%m%d")
      format(ts, "%Y-%m-%d")
    } else s
  }, character(1))
}

# Pick the most data-dense time-slice (max number of finite observations)
pick_densest_index <- function(sf_wide, var_names) {
  nn <- sapply(var_names, function(v) sum(is.finite(sf_wide[[v]])))
  which.max(nn)
}

# Build figure descriptions (viewer)
build_explanations <- function(fig_dir, pick_ts) {
  ts_label <- slug(pretty_time(pick_ts))
  files <- c(
    "timeseries_panel_grid.png",
    "timeseries_panel_grid.pdf",
    sprintf("u_curve_%s.png", ts_label),
    sprintf("u_curve_extras_%s.png", ts_label),
    sprintf("benchmark_%s.png", ts_label),
    sprintf("benchmark_extras_%s.png", ts_label)
  )
  paths <- file.path(fig_dir, files)
  desc  <- c(
    "Per-timestep KED previews; dots=stations; red=plot boundary.",
    "Same as PNG, vector PDF.",
    "U-curve for tuning R via block-CV (drift-only).",
    "U-curve with extra predictors.",
    "Method comparison at R* (lower RMSE is better).",
    "Benchmark with extras at R*."
  )
  keep <- file.exists(paths)
  out <- as.list(desc[keep]); names(out) <- basename(paths[keep])
  out
}
Why this matters: using fine pixels for scale estimation will cap \(R\) at a few pixels, resulting in the “10 m fallback”. Keep
DEM_scaleat a realistic native/coarser resolution for L/R.
1.2 1) Project & Paths
# Robust project root finder and paths
wd <- rprojroot::find_rstudio_root_file()

source(file.path(wd, "block4_5/all_functions_1.R"))   # consolidated toolkit

fn_DTM        <- file.path(wd, "block4_5/data_2024/copernicus_DEM.tif")
fn_stations   <- file.path(wd, "block4_5/data_2024/stations_prelim_modifiziert.gpkg")
fn_area       <- file.path(wd, "block4_5/data_2024/plot.shp")
fn_temp_FC29  <- file.path(wd, "block4_5/data_2024/all_GW1000A-WIFIFC29.xlsx")
fn_temp_DB2F  <- file.path(wd, "block4_5/data_2024/all_GW1000A-WIFIDB2F.xlsx")
cleandata_rds <- file.path(wd, "block4_5/data_2024/climdata.RDS")

out_dir    <- file.path(wd, "block4_5/interpolated")
fig_dir    <- file.path(out_dir, "fig")
method_dir <- file.path(out_dir, "methods_compare")
report_dir <- file.path(out_dir, "report")
for (d in c(out_dir, fig_dir, method_dir, report_dir)) if (!dir.exists(d)) dir.create(d, recursive = TRUE)

# CRS
epsg <- "EPSG:32633"  # UTM zone 33N
sf_crs_utm33 <- sf::st_crs(epsg)
1.3 2) Base Data & DEM Strategy
# DEMs
DEM_scale  <- terra::rast("data_2024/DEM.tif") |> terra::project(epsg)
DEM_scale  <- terra::aggregate(DEM_scale, c(20, 20))  # coarsen ~20–25 m (as in your working code)
names(DEM_scale) <- "altitude"
DEM_render <- DEM_scale |> terra::aggregate(fact = c(10, 10))  # for rendering products

cat("DEM_scale res (m): ", paste(terra::res(DEM_scale),  collapse=" x "), "\n")
DEM_scale res (m): 2.00223686801611 x 2.0022368680127 cat("DEM_render res (m):", paste(terra::res(DEM_render), collapse=" x "), "\n")DEM_render res (m): 20.0223686801606 x 20.022368680127 # Stations and plot boundary → same CRS
stations_pos <- sf::st_read(fn_stations, quiet = TRUE) |> sf::st_transform(sf_crs_utm33)
plot_area <- sf::st_read(fn_area, quiet = TRUE) |> sf::st_transform(sf_crs_utm33) |> sf::st_make_valid()
# Altitude from DEM_scale (not the upsampled one)
stations_pos <- stations_pos %>%
dplyr::mutate(altitude = exactextractr::exact_extract(DEM_scale, sf::st_buffer(stations_pos, 1), "mean"))
  |
  |                                                                                          |   0%
  |
  |======                                                                                    |   7%
  |
  |=============                                                                             |  14%
  |
  |===================                                                                       |  21%
  |
  |==========================                                                                |  29%
  |
  |================================                                                          |  36%
  |
  |=======================================                                                   |  43%
  |
  |=============================================                                             |  50%
  |
  |===================================================                                       |  57%
  |
  |==========================================================                                |  64%
  |
  |================================================================                          |  71%
  |
  |=======================================================================                   |  79%
  |
  |=============================================================================             |  86%
  |
  |====================================================================================      |  93%
  |
  |==========================================================================================| 100%
1.4 3) Ecowitt Ingestion, Cleaning, Aggregation
temp_FC29 <- extract_ecowitt_core_vars(fn_temp_FC29)New names:
New names:
• `` -> `...1`
• `` -> `...2`
• `` -> `...3`
• `` -> `...4`
• `` -> `...5`
• `` -> `...6`
• `` -> `...7`
• `` -> `...8`
• `` -> `...9`
• `` -> `...10`
• `` -> `...11`
• `` -> `...12`
• `` -> `...13`
• `` -> `...14`
• `` -> `...15`
• `` -> `...16`
• `` -> `...17`
• `` -> `...18`
• `` -> `...19`
• `` -> `...20`
• `` -> `...21`
• `` -> `...22`
• `` -> `...23`
• `` -> `...24`
• `` -> `...25`
• `` -> `...26`
• `` -> `...27`
• `` -> `...28`
• `` -> `...29`
• `` -> `...30`
• `` -> `...31`
• `` -> `...32`
• `` -> `...33`
• `` -> `...34`
• `` -> `...35`
• `` -> `...36`
• `` -> `...37`
• `` -> `...38`
• `` -> `...39`
• `` -> `...40`
• `` -> `...41`
• `` -> `...42`
• `` -> `...43`
• `` -> `...44`
• `` -> `...45`
• `` -> `...46`
• `` -> `...47`
• `` -> `...48`
• `` -> `...49`
• `` -> `...50`
• `` -> `...51`
• `` -> `...52`
• `` -> `...53`
• `` -> `...54`
• `` -> `...55`
• `` -> `...56`
• `` -> `...57`
• `` -> `...58`
• `` -> `...59`
• `` -> `...60`
• `` -> `...61`
• `` -> `...62`
• `` -> `...63`
• `` -> `...64`
• `` -> `...65`
• `` -> `...66`
• `` -> `...67`
• `` -> `...68`
• `` -> `...69`
• `` -> `...70`
• `` -> `...71`
• `` -> `...72`
• `` -> `...73`
• `` -> `...74`
• `` -> `...75`
• `` -> `...76`
• `` -> `...77`
• `` -> `...78`
• `` -> `...79`
• `` -> `...80`temp_DB2F <- extract_ecowitt_core_vars(fn_temp_DB2F)New names:
New names:
• `` -> `...1`
• `` -> `...2`
• `` -> `...3`
• `` -> `...4`
• `` -> `...5`
• `` -> `...6`
• `` -> `...7`
• `` -> `...8`
• `` -> `...9`
• `` -> `...10`
• `` -> `...11`
• `` -> `...12`
• `` -> `...13`
• `` -> `...14`
• `` -> `...15`
• `` -> `...16`
• `` -> `...17`
• `` -> `...18`
• `` -> `...19`
• `` -> `...20`
• `` -> `...21`
• `` -> `...22`
• `` -> `...23`
• `` -> `...24`
• `` -> `...25`
• `` -> `...26`
• `` -> `...27`
• `` -> `...28`
• `` -> `...29`
• `` -> `...30`
• `` -> `...31`
• `` -> `...32`
• `` -> `...33`
• `` -> `...34`
• `` -> `...35`
• `` -> `...36`
• `` -> `...37`
• `` -> `...38`
• `` -> `...39`
• `` -> `...40`
• `` -> `...41`
• `` -> `...42`
• `` -> `...43`
• `` -> `...44`
• `` -> `...45`
• `` -> `...46`
• `` -> `...47`
• `` -> `...48`
• `` -> `...49`
• `` -> `...50`
• `` -> `...51`
• `` -> `...52`
• `` -> `...53`
• `` -> `...54`
• `` -> `...55`
• `` -> `...56`
• `` -> `...57`t_rh_all <- merge_ecowitt_logger_vars(temp_FC29, temp_DB2F)
# Clean display names and map to verbose station names
for (meas in c("temperature","humidity")) {
t_rh_all[[meas]] <- t_rh_all[[meas]] %>%
dplyr::rename_with(~ to_verbose(.x, ifelse(meas=="temperature","Temperature","Humidity")), -Time) %>%
clean_names()
}
# Aggregate to 3-hour steps
temp_agg <- t_rh_all$temperature %>%
dplyr::mutate(time = lubridate::floor_date(Time, "3 hours")) %>%
dplyr::group_by(time) %>%
dplyr::summarise(across(where(is.numeric), ~ mean(.x, na.rm = TRUE)), .groups = "drop")
names(temp_agg) <- clean_ids(names(temp_agg))
# long → wide matrix: station rows, time columns
temp_matrix <- temp_agg %>%
tidyr::pivot_longer(cols = -time, names_to = "stationid", values_to = "value") %>%
tidyr::pivot_wider(names_from = time, values_from = value)
# Join to station geometry and altitude
stations_pos <- stations_pos %>% dplyr::mutate(stationid = to_verbose(stationid))
m <- dplyr::left_join(stations_pos, temp_matrix, by = "stationid")
# Hygiene
stations_pos$stationid <- gsub("\\(℃\\)|\\(%\\)|\\(\\%\\)", "", stations_pos$stationid)
m$stationid <- gsub("\\(℃\\)|\\(%\\)|\\(\\%\\)", "", m$stationid)
names(m) <- fix_names(names(m))
saveRDS(m, cleandata_rds)1.5 4) Interpolation Preview (Per-Timestep KED)
min_pts <- 5
vars <- as.list(grep("^A\\d{8,14}", names(m), value = TRUE))

kriged_list <- lapply(vars, function(v) {
  interpolate_kriging(v, m, DEM_render, output_dir = out_dir, label = "pretty")
})
Interpolating: A20230827150000Warning in interpolate_kriging(v, m, DEM_render, output_dir = out_dir, label = "pretty"): Variogram
failed for A20230827150000Interpolating: A20230827180000Warning in interpolate_kriging(v, m, DEM_render, output_dir = out_dir, label = "pretty"): Variogram
failed for A20230827180000Interpolating: A20230828150000Warning in interpolate_kriging(v, m, DEM_render, output_dir = out_dir, label = "pretty"): Variogram
failed for A20230828150000Interpolating: A20230828180000Warning in interpolate_kriging(v, m, DEM_render, output_dir = out_dir, label = "pretty"): Variogram
failed for A20230828180000Interpolating: A20230828210000Warning in interpolate_kriging(v, m, DEM_render, output_dir = out_dir, label = "pretty"): Variogram
failed for A20230828210000Interpolating: A20230829Warning in interpolate_kriging(v, m, DEM_render, output_dir = out_dir, label = "pretty"): Variogram
failed for A20230829Interpolating: A20230829030000Warning in interpolate_kriging(v, m, DEM_render, output_dir = out_dir, label = "pretty"): Variogram
failed for A20230829030000Interpolating: A20230829060000Warning in interpolate_kriging(v, m, DEM_render, output_dir = out_dir, label = "pretty"): Variogram
failed for A20230829060000Interpolating: A20230829090000[using universal kriging]✔ Written: /home/creu/edu/gisma-courses/EON2025/block4_5/interpolated/A20230829090000_interpolated.tifInterpolating: A20230829120000[using universal kriging]✔ Written: /home/creu/edu/gisma-courses/EON2025/block4_5/interpolated/A20230829120000_interpolated.tifInterpolating: A20230829150000[using universal kriging]✔ Written: /home/creu/edu/gisma-courses/EON2025/block4_5/interpolated/A20230829150000_interpolated.tifInterpolating: A20230829180000[using universal kriging]✔ Written: /home/creu/edu/gisma-courses/EON2025/block4_5/interpolated/A20230829180000_interpolated.tifInterpolating: A20230829210000[using universal kriging]✔ Written: /home/creu/edu/gisma-courses/EON2025/block4_5/interpolated/A20230829210000_interpolated.tifInterpolating: A20230830[using universal kriging]✔ Written: /home/creu/edu/gisma-courses/EON2025/block4_5/interpolated/A20230830_interpolated.tifInterpolating: A20230830030000Warning in interpolate_kriging(v, m, DEM_render, output_dir = out_dir, label = "pretty"): Variogram
failed for A20230830030000Interpolating: A20230830060000Warning in interpolate_kriging(v, m, DEM_render, output_dir = out_dir, label = "pretty"): Variogram
failed for A20230830060000Interpolating: A20230830090000[using universal kriging]✔ Written: /home/creu/edu/gisma-courses/EON2025/block4_5/interpolated/A20230830090000_interpolated.tifInterpolating: A20230830120000[using universal kriging]✔ Written: /home/creu/edu/gisma-courses/EON2025/block4_5/interpolated/A20230830120000_interpolated.tifInterpolating: A20230830150000Warning in interpolate_kriging(v, m, DEM_render, output_dir = out_dir, label = "pretty"): Variogram
failed for A20230830150000Interpolating: A20230830180000Warning in interpolate_kriging(v, m, DEM_render, output_dir = out_dir, label = "pretty"): Variogram
failed for A20230830180000Interpolating: A20230830210000[using universal kriging]✔ Written: /home/creu/edu/gisma-courses/EON2025/block4_5/interpolated/A20230830210000_interpolated.tifInterpolating: A20230831[using universal kriging]✔ Written: /home/creu/edu/gisma-courses/EON2025/block4_5/interpolated/A20230831_interpolated.tifInterpolating: A20230831030000Warning in interpolate_kriging(v, m, DEM_render, output_dir = out_dir, label = "pretty"): Variogram
failed for A20230831030000Interpolating: A20230831060000Warning in interpolate_kriging(v, m, DEM_render, output_dir = out_dir, label = "pretty"): Variogram
failed for A20230831060000Interpolating: A20230831090000[using universal kriging]✔ Written: /home/creu/edu/gisma-courses/EON2025/block4_5/interpolated/A20230831090000_interpolated.tifInterpolating: A20230831120000[using universal kriging]✔ Written: /home/creu/edu/gisma-courses/EON2025/block4_5/interpolated/A20230831120000_interpolated.tifInterpolating: A20230831150000Warning in interpolate_kriging(v, m, DEM_render, output_dir = out_dir, label = "pretty"): Variogram
failed for A20230831150000Interpolating: A20230831180000Warning in interpolate_kriging(v, m, DEM_render, output_dir = out_dir, label = "pretty"): Variogram
failed for A20230831180000Interpolating: A20230831210000[using universal kriging]✔ Written: /home/creu/edu/gisma-courses/EON2025/block4_5/interpolated/A20230831210000_interpolated.tifInterpolating: A20230901Warning in interpolate_kriging(v, m, DEM_render, output_dir = out_dir, label = "pretty"): Variogram
failed for A20230901names(kriged_list) <- vars# Shared color scale across all timestamps
panel <- timeseries_panel(
kriged_list = kriged_list,
plot_area = plot_area,
stations_pos = stations_pos,
cells_target = 150000,
max_cols = 4,
label_pretty_time = TRUE,
out_png = file.path(fig_dir, "timeseries_panel_grid.png"),
out_pdf = file.path(fig_dir, "timeseries_panel_grid.pdf"),
fill_label = "Temperature"
)Coordinate system already present. Adding new coordinate system, which will replace the existing
one.panel$plot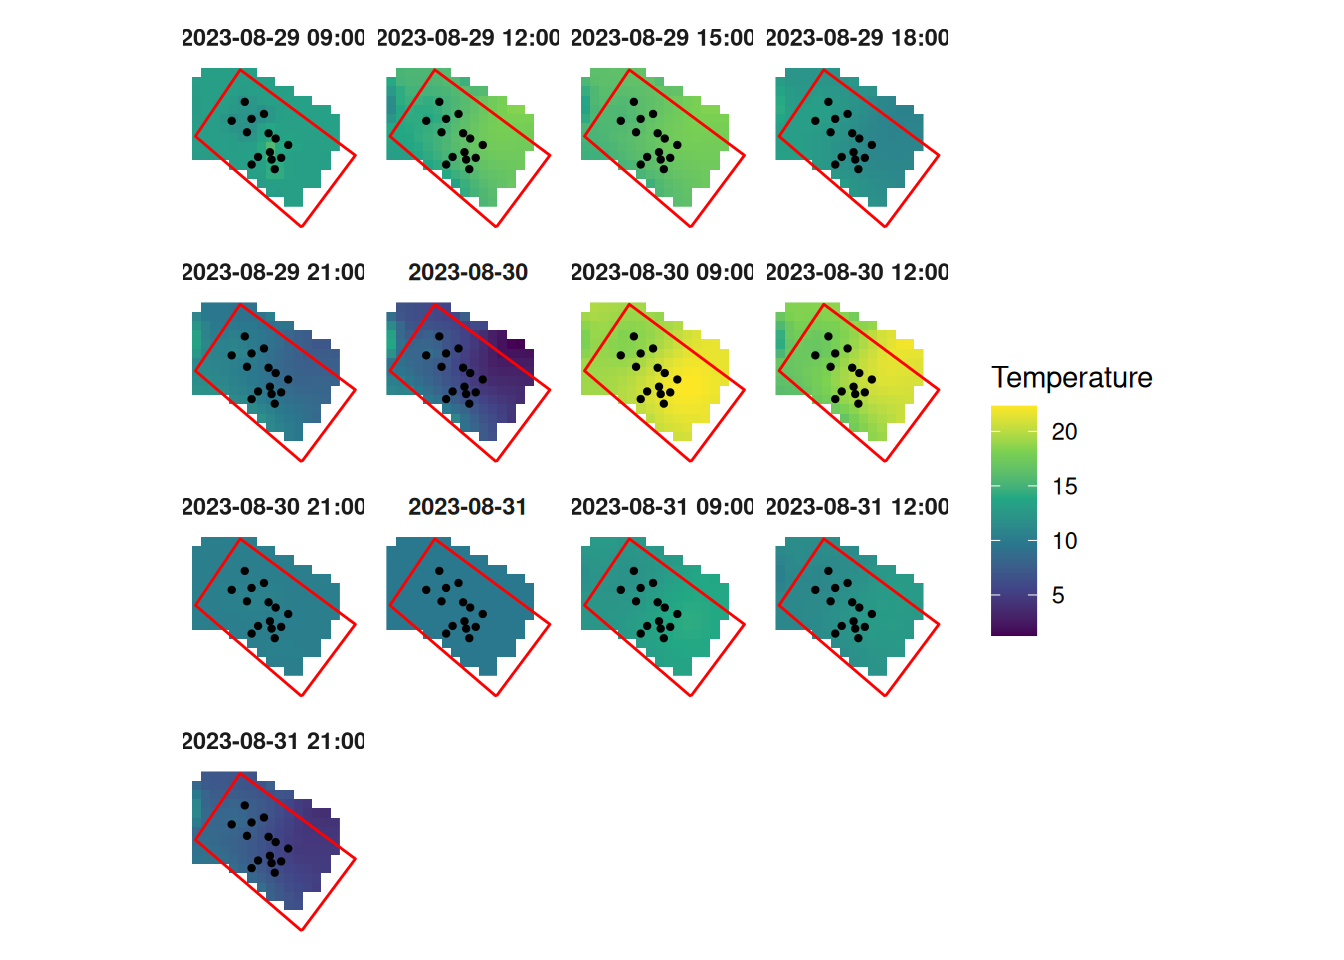
1.6 5) Method Comparison for Densest Timestamp (Working Code)
# Densest timestamp
pick_idx <- pick_densest_index(m, vars)
pick_ts  <- names(m)[pick_idx]

# Extra predictors (kept as in your working code)
extra_list <- list(
  slope  = terra::terrain(DEM_scale, v = "slope",  unit = "degrees"),
  aspect = terra::terrain(DEM_scale, v = "aspect"),
  tri    = terra::terrain(DEM_scale, v = "TRI")
)

# One timestamp (densest), with extras
res_one <- run_one(
  v           = vars[[pick_idx]],
  m           = m,
  DEM_render  = DEM_render,
  DEM_scale   = DEM_scale,
  method_dir  = method_dir,
  fig_dir     = fig_dir,
  report_dir  = report_dir,
  extra_preds = extra_list,
  save_figs   = TRUE
)
Warning in newton(lsp = lsp, X = G$X, y = G$y, Eb = G$Eb, UrS = G$UrS, L = G$L, : Fitting
terminated with step failure - check results carefullyWarning in log(b$scale.est): NaNs produced
Warning in log(b$scale.est): NaNs producedWarning in newton(lsp = lsp, X = G$X, y = G$y, Eb = G$Eb, UrS = G$UrS, L = G$L, : Fitting
terminated with step failure - check results carefullyWarning in log(b$scale.est): NaNs producedWarning in newton(lsp = lsp, X = G$X, y = G$y, Eb = G$Eb, UrS = G$UrS, L = G$L, : Fitting
terminated with step failure - check results carefully
Warning in newton(lsp = lsp, X = G$X, y = G$y, Eb = G$Eb, UrS = G$UrS, L = G$L, : Fitting
terminated with step failure - check results carefully
Warning in newton(lsp = lsp, X = G$X, y = G$y, Eb = G$Eb, UrS = G$UrS, L = G$L, : Fitting
terminated with step failure - check results carefully
Warning in log(b$scale.est): NaNs producedWarning in newton(lsp = lsp, X = G$X, y = G$y, Eb = G$Eb, UrS = G$UrS, L = G$L, : Fitting
terminated with step failure - check results carefullyWarning in log(b$scale.est): NaNs producedWarning in newton(lsp = lsp, X = G$X, y = G$y, Eb = G$Eb, UrS = G$UrS, L = G$L, : Fitting
terminated with step failure - check results carefullyWarning in log(b$scale.est): NaNs producedWarning in newton(lsp = lsp, X = G$X, y = G$y, Eb = G$Eb, UrS = G$UrS, L = G$L, : Fitting
terminated with step failure - check results carefully
Warning in newton(lsp = lsp, X = G$X, y = G$y, Eb = G$Eb, UrS = G$UrS, L = G$L, : Fitting
terminated with step failure - check results carefully
Warning in newton(lsp = lsp, X = G$X, y = G$y, Eb = G$Eb, UrS = G$UrS, L = G$L, : Fitting
terminated with step failure - check results carefully
Warning in newton(lsp = lsp, X = G$X, y = G$y, Eb = G$Eb, UrS = G$UrS, L = G$L, : Fitting
terminated with step failure - check results carefully
Warning in log(b$scale.est): NaNs producedWarning in newton(lsp = lsp, X = G$X, y = G$y, Eb = G$Eb, UrS = G$UrS, L = G$L, : Fitting
terminated with step failure - check results carefully
Warning in newton(lsp = lsp, X = G$X, y = G$y, Eb = G$Eb, UrS = G$UrS, L = G$L, : Fitting
terminated with step failure - check results carefully[inverse distance weighted interpolation]
[using ordinary kriging]
[using universal kriging]
[inverse distance weighted interpolation]
[using ordinary kriging]
[using universal kriging]R*: tuner failed; falling back to 56.8593 m.Warning in x@pntr$rastDistance(target, exclude, keepNA, tolower(unit), TRUE, : GDAL Message 1:
Pixels not square, distances will be inaccurate.[using ordinary kriging]
[inverse distance weighted interpolation]
[using universal kriging]
[using ordinary kriging]
[inverse distance weighted interpolation]
[using universal kriging]
[using ordinary kriging]
[inverse distance weighted interpolation]
[using universal kriging]
[using ordinary kriging]
[inverse distance weighted interpolation]
[using universal kriging]
[using ordinary kriging]
[inverse distance weighted interpolation]
[using universal kriging]
[using ordinary kriging]
[inverse distance weighted interpolation]
[using universal kriging][using ordinary kriging]
[using ordinary kriging]
[using ordinary kriging]
[using ordinary kriging]
[using ordinary kriging]
[using ordinary kriging]
[using ordinary kriging]
[using ordinary kriging]
[using ordinary kriging]
[using ordinary kriging]
[using ordinary kriging]
[using ordinary kriging]
[using ordinary kriging]
[using ordinary kriging]
[using ordinary kriging]
[using ordinary kriging]1.7 6) (Optional) Compute All Time Steps
compute_all <- FALSE

if (isTRUE(compute_all)) {
  req <- c("m","DEM_render","DEM_scale","method_dir","fig_dir","report_dir")
  miss <- req[!vapply(req, exists, logical(1), inherits = TRUE)]
  if (length(miss)) stop("Fehlende Objekte im Environment: ", paste(miss, collapse = ", "))

  .best_from_bench <- function(bench_obj) {
    if (is.null(bench_obj) || !is.data.frame(bench_obj$table) || nrow(bench_obj$table) < 1)
      return(NULL)
    b <- bench_obj$table
    b <- b[is.finite(b$RMSE), , drop = FALSE]
    if (!nrow(b)) return(NULL)
    b <- b[order(b$RMSE), , drop = FALSE]
    b[1, c("method","RMSE"), drop = FALSE]
  }

  message(sprintf("Starte compute_all für %d Zeitschritte …", length(vars)))

  res_all <- setNames(lapply(vars, function(vv) {
    message("→ run_one: ", pretty_time(vv))
    tryCatch(
      run_one(
        v           = vv,
        m           = m,
        DEM_render  = DEM_render,
        DEM_scale   = DEM_scale,
        method_dir  = method_dir,
        fig_dir     = fig_dir,
        report_dir  = report_dir,
        extra_preds = extra_list,
        save_figs   = TRUE,
        save_tables = TRUE
      ),
      error = function(e) {
        warning("run_one fehlgeschlagen für ", vv, ": ", conditionMessage(e))
        NULL
      }
    )
  }), vars)

  saveRDS(res_all, file.path(report_dir, "all_results.RDS"))

  summ <- do.call(rbind, lapply(names(res_all), function(k) {
    r <- res_all[[k]]
    if (is.null(r)) {
      return(data.frame(
        ts_key      = k,
        stamp       = pretty_time(k),
        R_star      = NA_real_,
        best_source = NA_character_,  # "no_extras"/"with_extras"
        best_method = NA_character_,
        best_RMSE   = NA_real_
      ))
    }
    rstar <- suppressWarnings(as.numeric(r$tune$R_star))
    if (!is.finite(rstar)) rstar <- NA_real_

    b0 <- .best_from_bench(r$bench)
    bE <- .best_from_bench(r$bench_ex)

    score0 <- if (!is.null(b0) && isTRUE(is.finite(b0$RMSE))) b0$RMSE else Inf
    scoreE <- if (!is.null(bE) && isTRUE(is.finite(bE$RMSE))) bE$RMSE else Inf

    if (is.infinite(score0) && is.infinite(scoreE)) {
      src <- NA_character_; bm <- NA_character_; br <- NA_real_
    } else if (score0 <= scoreE) {
      src <- "no_extras"; bm <- b0$method; br <- score0
    } else {
      src <- "with_extras"; bm <- bE$method; br <- scoreE
    }

    data.frame(
      ts_key      = k,
      stamp       = pretty_time(k),
      R_star      = rstar,
      best_source = src,
      best_method = bm,
      best_RMSE   = br
    )
  }))

  utils::write.csv(summ, file.path(report_dir, "summary_Rstar_bestmethod.csv"), row.names = FALSE)
  message("✔ Fertig: summary_Rstar_bestmethod.csv geschrieben.")
}
1.8 7) Save CSVs for the One Timestamp
ts_label <- pretty_time(pick_ts)
bench_base_csv <- file.path(report_dir, sprintf("benchmark_%s.csv",        slug(ts_label)))
bench_ex_csv   <- file.path(report_dir, sprintf("benchmark_extras_%s.csv", slug(ts_label)))
eb_base_csv    <- file.path(report_dir, sprintf("error_budget_%s.csv",     slug(ts_label)))
eb_ex_csv      <- file.path(report_dir, sprintf("error_budget_extras_%s.csv", slug(ts_label)))

if (is.list(res_one$bench)    && is.data.frame(res_one$bench$table))    write.csv(res_one$bench$table,    bench_base_csv, row.names = FALSE)
if (is.list(res_one$bench_ex) && is.data.frame(res_one$bench_ex$table)) write.csv(res_one$bench_ex$table, bench_ex_csv,   row.names = FALSE)
if (is.data.frame(res_one$errtab))    write.csv(res_one$errtab,    eb_base_csv, row.names = FALSE)
if (is.data.frame(res_one$errtab_ex)) write.csv(res_one$errtab_ex, eb_ex_csv,   row.names = FALSE)
1.9 8) Console Summary
n_stations <- nrow(stations_pos)
n_pts_ts   <- sum(is.finite(m[[pick_ts]]))
Ls         <- get_Ls(res_one$wf$L)
Ls_e       <- if (!is.null(res_one$wf_ex)) get_Ls(res_one$wf_ex$L) else NULL
Rstar_base <- suppressWarnings(as.numeric(res_one$tune$R_star))
Rstar_ex   <- suppressWarnings(as.numeric(res_one$tune_ex$R_star))

cat(sprintf("Chosen R (micro/local): %s / %s m\n",
            ifelse(is.finite(res_one$wf$R['micro']), round(res_one$wf$R['micro']), "NA"),
            ifelse(is.finite(res_one$wf$R['local']), round(res_one$wf$R['local']), "NA")
))
Chosen R (micro/local): 19 / 57 m1.10 9) Shiny Viewer (Optional, uses existing files)
The viewer launches a Shiny app; to not block Quarto rendering, the launch is wrapped in
if (interactive()).
# Minimal viewer injection: use your working run_mc_viewer() with robust file matching
raster_path <- function(method, ts) {
  stopifnot(length(method) == 1, length(ts) == 1)
  m <- tolower(method)
  .ts_tokens <- function(ts_key) {
    raw <- tolower(as.character(ts_key))
    pty <- tolower(pretty_time(ts_key))
    slug_pt <- gsub("[^0-9A-Za-z_-]+","-", pty)
    d14 <- sub("^a", "", raw)
    ymd  <- if (nchar(d14) >= 8) substr(d14,1,8) else NA_character_
    hhmm <- if (nchar(d14) >= 12) substr(d14,9,12) else NA_character_
    comp1 <- if (!is.na(ymd) && !is.na(hhmm))
      paste0(substr(ymd,1,4),"-",substr(ymd,5,6),"-",substr(ymd,7,8),"-",
             substr(hhmm,1,2),"-",substr(hhmm,3,4)) else NA_character_
    comp2 <- gsub("-", "", comp1)
    ymd_dash <- if (!is.na(ymd)) paste0(substr(ymd,1,4),"-",substr(ymd,5,6),"-",substr(ymd,7,8)) else NA_character_
    unique(na.omit(c(raw, slug_pt, comp1, comp2, ymd_dash, ymd)))
  }
  toks <- .ts_tokens(ts)
  tok_rx <- gsub("[-_]", "[-_]", toks)

  all_files <- list.files(method_dir, pattern = "\\.tif$", full.names = TRUE, ignore.case = TRUE)
  if (!length(all_files)) return(NA_character_)
  b <- tolower(basename(all_files))

  keep_pref <- grepl(paste0("^", m, "_"), b)
  files_m <- all_files[keep_pref]; b_m <- b[keep_pref]
  if (length(files_m)) {
    score <- vapply(seq_along(b_m), function(i) {
      max(c(0, vapply(tok_rx, function(rx) if (grepl(rx, b_m[i], perl = TRUE)) nchar(rx) else 0L, integer(1))))
    }, numeric(1))

    if (any(score > 0)) {
      best <- files_m[score == max(score)]
      bbest <- tolower(basename(best))
      idxR <- grep("_rstar\\.tif$", bbest)
      if (length(idxR)) return(best[idxR[1]])
      idxL <- grep("_l95\\.tif$", bbest)
      if (length(idxL)) return(best[idxL[1]])
      return(best[1])
    }
  }

  if (toupper(method) %in% c("KED","PREVIEW")) {
    out_dir_local <- dirname(method_dir)
    prev <- list.files(out_dir_local, pattern = "\\.tif$", full.names = TRUE, ignore.case = TRUE)
    if (length(prev)) {
      bp <- tolower(basename(prev))
      rx_prev <- paste0("^(", paste0(tok_rx, collapse = "|"), ")_interpolated(_wgs84)?\\.tif$")
      hit <- grepl(rx_prev, bp, perl = TRUE)
      if (any(hit)) return(prev[which(hit)[1]])
    }
  }
  NA_character_
}
# Only launch interactively
if (interactive()) {
explanations <- build_explanations(fig_dir = fig_dir, pick_ts = vars[[pick_idx]])
run_mc_viewer(
vars = vars,
method_dir = method_dir,
fig_dir = fig_dir,
stations_pos = stations_pos,
plot_area = plot_area,
wf = res_one$wf,
wf_ex = res_one$wf_ex,
tune = res_one$tune,
tune_ex = res_one$tune_ex,
bench = res_one$bench,
bench_ex = res_one$bench_ex,
tab_err = res_one$errtab,
tab_err_ex = res_one$errtab_ex,
explanations = explanations
)
}